The data we collect under each of our five thematic strands will be made freely accessible in a consistent and inter-connected way via an online relational database – designed and created in collaboration with colleagues at HRI Digital – in which our Project Leaders and Research Associates will record the data, or ‘entities’, extracted from their analysis of the primary source materials. The resulting research tool will be an interactive website, providing free access to the datasets generated by the project, and allowing the research team and a wider community of users to explore the relationships between the economic, social, political, material, and cultural realms of early modern intoxication.
These include people, places, objects (such as drinking vessels, printed images), organisations, language (context-specific terminology), and events (such as legislation or transactions). Each of these entities will have its own set of characteristics as well as relationships with one or more other entities. The resulting ‘ontology’ will enable the PI, Co-Is, and RAs to interrogate the entire range of data and visualise the results in ways which reveal trends and relationships that are not evident when consulting the documents individually. For example, changing volumes of tobacco or numbers of licence holders or uses of the word ‘drunkenness’ can be traced and contextualised diachronically whilst relationships between entities – for example tobacco, licences, and ‘drunkenness’ – are revealed synchronically.
Main Datasets
Port Books
- 164 port books
- 29,988 origins and destinations
- 8,472 ships
- 8,128 merchants
- 16,468 consignments
Court Depositions
- 1,137 cases
- 2,876 witness statements
- 1,877 events
- 6,179 participants
Orders, Presentments, Licences, and Petitions
- 528 orders
- 3,443 presentments
- c.300 petitions
- c.1,500 petitioners
- 9,472 licencees
- c.19,000 surety providers
Probate Inventories
- 630 inventories
- 1,474 appraisers
- c.5,000 rooms
- c.30,000 entries
Visualisation and Analysis

Exploring some visualisation options for port book data during a project meeting.
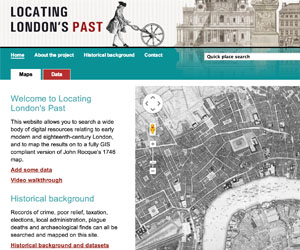
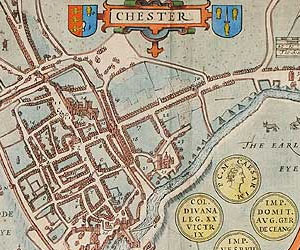
As well as allowing full-text searching and standard results listings, we will also be incorporating tools for the comparison and analysis of intoxication data. Data-mining and visualisation techniques will include: cluster analysis, network visualisation, topic maps, geographical mapping, tree maps, and graphs and charts. Geographical mapping of data will be implemented in a manner similar to HRI Digital’s award-winning, JISC-funded website Locating London’s Past. John Speed’s seventeenth-century county and city maps will be digitised and the boundaries of all historical places (parishes, streets etc) identified (as pixel-referenced polygons). By creating and cross-referencing a pixel-referenced gazetteer, all location-based data, as well as any related data, within the database can be plotted onto the historical maps (using GoogleMaps API) in response to search requests. This means that relationships and trends between entities occurring within different datasets (such as port books and provincial licences) can be visualised together, both geographically and temporally.
The types of entities to be recorded in the database, their relationships to each other, and thus the search and visualisation techniques available will not be restricted to intoxicant-specific research questions. Focus group work, to be conducted during the specification phases, will consult a representative sample of social and economic historians and postgraduate researchers with a view to ensuring that the recorded data and user interface will be of use to a much wider range of research interests than those represented within the project.


Locating London’s Past (top). The project will be applying similar digital mapping techniques to the landscapes of intoxication in Norwich and Chester.
